
In the previous post I stopped at building the column chart using FusionCharts library. In this post I am going to show you how to beautify the chart by changing its appearance namely background, border, canvas background, canvas border and data plot appearance. If you are coming to this post directly then I would recommend you to read this post to setup the data for the chart and also to display the basic version of the chart.
also read:
- Using JavaFX Chart API to add charts to Swing applications
- Pie Charts using DOJO
- PrimeFaces Charts – Pie Chart + Ajax Behavior Events Example
In this post I am going to show you how to:
- Change the background and border of the chart.
- Change the background and border of the canvas of the chart.
- Change the background and border of the data plot.
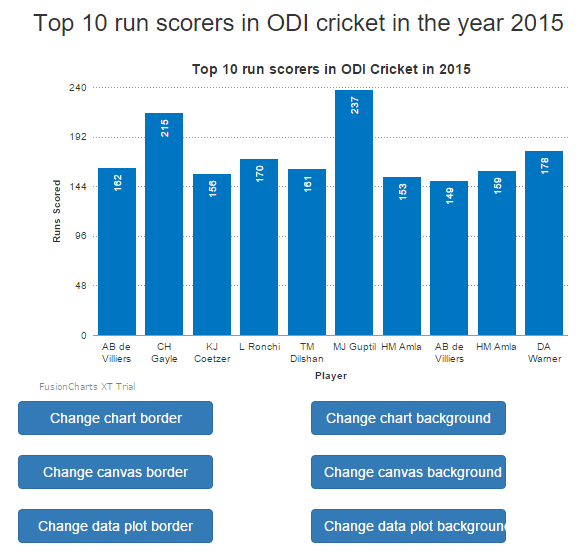
I am going to create 3 buttons to perform each of the above 3 tasks. For that I have updated the column_chart_sample.html as shown below:
<!DOCTYPE html>
<html>
<head>
<title>Sample for Column Chart using FusionChart</title>
<link rel="stylesheet" href="css/bootstrap.css"/>
</head>
<body>
<div class="container">
<div class="row">
<div class="col-md-12">
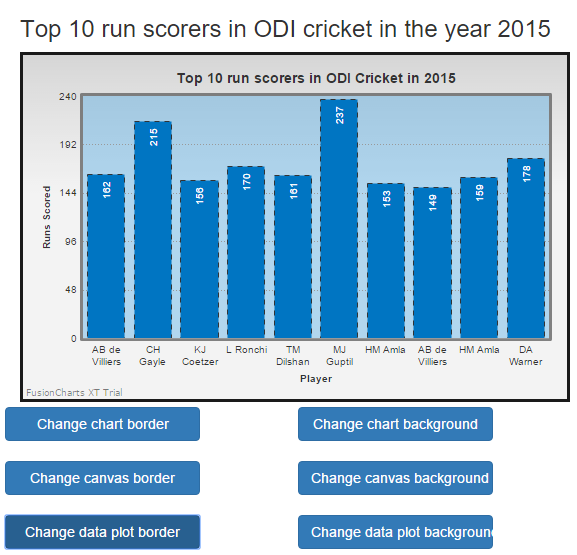
<h3>Top 10 run scorers in ODI cricket in the year 2015</h3>
<!-- Container for rendering the chart -->
<div id="chart-container"></div>
</div>
</div>
<!-- Buttons for changing the appearance of the chart -->
<div class="row">
<div>
<button type="button" id="chartBorderBtn" class="col-md-2 btn btn-primary">
Change chart border
</button>
</div>
<div>
<button type="button" id="chartBackgroundBtn" class="col-md-2 col-md-offset-1 btn btn-primary">
Change chart background
</button>
</div>
</div>
<br/>
<div class="row">
<div>
<button type="button" id="canvasBorderBtn" class="col-md-2 btn btn-primary">
Change canvas border
</button>
</div>
<div>
<button type="button" id="canvasBackgroundBtn" class="col-md-2 col-md-offset-1 btn btn-primary">
Change canvas background
</button>
</div>
</div>
<br/>
<div class="row">
<div>
<button type="button" id="dataPlotBorderBtn" class="col-md-2 btn btn-primary">
Change data plot border
</button>
</div>
<div>
<button type="button" id="dataPlotBackgroundBtn" class="col-md-2 col-md-offset-1 btn btn-primary">
Change data plot background
</button>
</div>
</div>
</div>
<!-- jQuery Javascript -->
<script src="js/jquery-2.1.4.js"></script>
<script src="js/bootstrap.js"></script>
<!-- FusionCharts related Javascript library -->
<script src="js/fusioncharts.js"></script>
<script src="js/fusioncharts.charts.js"></script>
<script src="js/fusioncharts.theme.zune.js"></script>
<script src="js/column_chart_sample.js"></script>
</body>
</html>
The above highlighted code is the new addition. Loading the updated HTML results in the display as shown below:
 The javascript code also needs to be updated to accommodate the handlers for the new buttons. The updated code for column_chart_sample.js is as shown below:
var chartData;
$(function(){
  $("#chartBorderBtn").click(function(){
    changeChartBorder();
  });

  $("#chartBackgroundBtn").click(function(){
    changeChartBackground();
  });

  $("#canvasBorderBtn").click(function(){
    changeCanvasBorder();
  });

  $("#canvasBackgroundBtn").click(function(){
    changeCanvasBackground();
  });

  $("#dataPlotBorderBtn").click(function(){
    changeDataPlotBorder();
  });

  $("#dataPlotBackgroundBtn").click(function(){
    changeDataPlotBackground();
  });

  $.ajax({

    url: 'http://localhost:3300/scores',
    type: 'GET',
    crossDomain: true,
    success : function(data) {
      chartData = data;
      var chartProperties = {
        "caption": "Top 10 run scorers in ODI Cricket in 2015",
        "xAxisName": "Player",
        "yAxisName": "Runs Scored",
        "rotatevalues": "1",
        "theme": "zune"
      };

      var apiChart = new FusionCharts({
        type: 'column2d',
        renderAt: 'chart-container',
        width: '550',
        height: '350',
        dataFormat: 'json',
        dataSource: {
          "chart": chartProperties,
          "data": chartData
        }
      });
      apiChart.render();
    }
  });
});

function changeChartBorder(){}
function changeChartBackground(){}
function changeCanvasBorder(){}
function changeCanvasBackground(){}
function changeDataPlotBorder(){}
function changeDataPlotBackground(){}
In the above javascript code the updated code has been highlighted.
In the rest of the post I would be writing the code for the 6 button handlers and during that show you how to make use of the different chart properties.
Changing the chart border
FusionCharts API provides an API setChartAttribute to modify the chart properties. The API takes either two parameters i.e the property name and its value OR one parameter which is the JSON object of the chart properties. I would be using the latter approach of building the JSON object of properties. Below is the JSON object of properties:
var borderProperties = {
  //whether to show the border or not.
  "showBorder":1,
  //color of the border
  "borderColor":"#000000",
  //thickness of the border
  "borderThickness":3,
  //opacity of the border
  "borderAlpha":90
}
The complete implementation of the changeChartBorder method is shown below:
function changeChartBorder(){
  var borderProperties = {
    //whether to show the border or not.
    "showBorder":1,
    //color of the border
    "borderColor":"#000000",
    //thickness of the border
    "borderThickness":3,
    //opacity of the border
    "borderAlpha":90
  }
  apiChart.setChartAttribute(borderProperties);
}
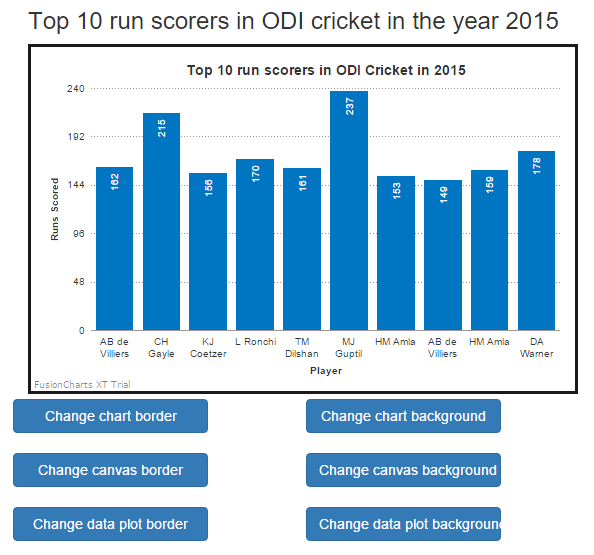
Let us reload the page again and click on the Change chart border button to see the below changes applied:
Changing chart background
To fill the chart background we can use a single color, gradient and an image. To demonstrate I would make use of a gradient fill. A gradient fill would require more than 1 color and the ratio of contribution of each color to fill the background. The properties JSON object of chart background would be as shown below:
var backgroundProperties = {
  //colors to be used for chart background
  "bgColor":"EEEEEE,CCCCCC",
  //transperancy of each color
  "bgAlpha" : "70,80",
  //contribution of each color to the gradient of the background
  "bgRatio":"60, 40",
  //setting the canvas area as transperant
  "canvasBgAlpha":0
};
The complete imlementation of changeChartBackground is shown below:
function changeChartBackground(){
  var backgroundProperties = {
    //colors to be used for chart background
    "bgColor":"EEEEEE,CCCCCC",
    //transperancy of each color
    "bgAlpha" : "70,80",
    //contribution of each color to the gradient of the background
    "bgRatio":"60, 40",
    //setting the canvas area as transperant
    "canvasBgAlpha":0
  };
  apiChart.setChartAttribute(backgroundProperties);
}
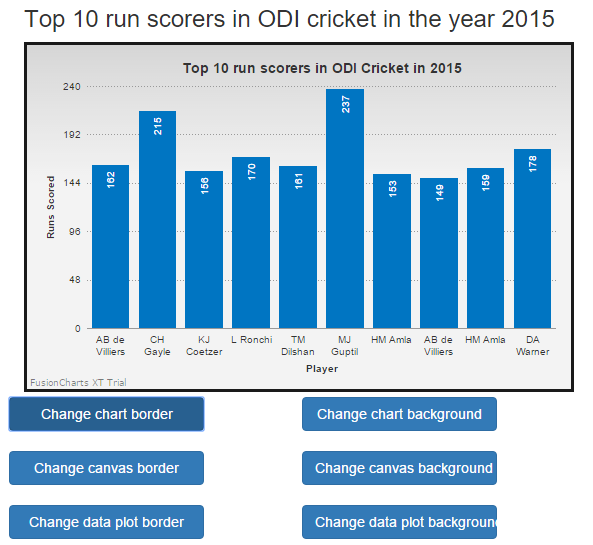
Let us reload the page and click on the Change chart background button to see changes. The chart after applying the chart background looks like:
Changing canvas border
Canvas is that area of the chart which contains the x-axis and y-axis and the are between the axis. The below is the JSON object for the canvas border properties:
var canvasBorderProperties = {
  //showing canvas border or not
  "showCanvasBorder" : 1,
  //border of the canvas
  "canvasBorderColor" : "#666666",
  //thickness of the canvas border
  "canvasBorderThickness": 3,
  //opacity of the canvas background
  "canvasBorderAlpha":80
};
The implementation of changeCanvasBorder() method is given below:
function changeCanvasBorder(){
  var canvasBorderProperties = {
    //showing canvas border or not
    "showCanvasBorder" : 1,
    //border of the canvas
    "canvasBorderColor" : "#666666",
    //thickness of the canvas border
    "canvasBorderThickness": 3,
    //opacity of the canvas background
    "canvasBorderAlpha":80
  };
  apiChart.setChartAttribute(canvasBorderProperties);
}
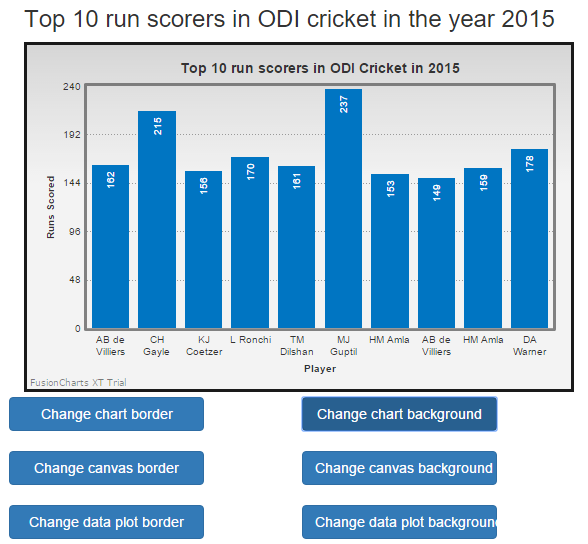
The chart after application of canvas border looks like below:
Changing the canvas background
The below JSON object represents the properties for modifying the canvas background:
var canvasBackgroundProperties = {
  //background color for the canvas
  "canvasBgColor":"#1790e1",
  //opacity of the background color
  "canvasBgAlpha" : 30
};
In this case I am not using a gradient to fill the canvas, instead using single color. The implementation of the changeCanvasBackground method is shown below:
function changeCanvasBackground(){
  var canvasBackgroundProperties = {
    //background color for the canvas
    "canvasBgColor":"#1790e1",
    //opacity of the background color
    "canvasBgAlpha" : 30
  };
  apiChart.setChartAttribute(canvasBackgroundProperties);
}
The chart after applying the canvas background looks like:

Changing data plot border
Data plot is that area which plots the data on the canvas. It is the columns in case of column chart or lines in case of line graph, pie in case of pie chart and so on. We can configure its border as well as its background. The below properties are for configuring its border:
var dataPlotBorderProperties(){
  //whether to show the border for data plot
  "showPlotBorder" : 1,
  //whether the data plot border is dashed or not
  "plotBorderDashed":1,
  //length of the dash in the data plot border
  "plotBorderDashLen": 5,
  //gap between the dash in the data plot border
  "plotBorderDashGap": 5
};
The implementation of the changeDataPlotBorder() method is shown below:
function changeDataPlotBorder(){
  var dataPlotBorderProperties(){
    //whether to show the border for data plot
    "showPlotBorder" : 1,
    //whether the data plot border is dashed or not
    "plotBorderDashed":1,
    //length of the dash in the data plot border
    "plotBorderDashLen": 5,
    //gap between the dash in the data plot border
    "plotBorderDashGap": 5
  };
  apiChart.setChartAttribute(dataPlotBorderProperties);
}
The chart with the data plot border looks like below:
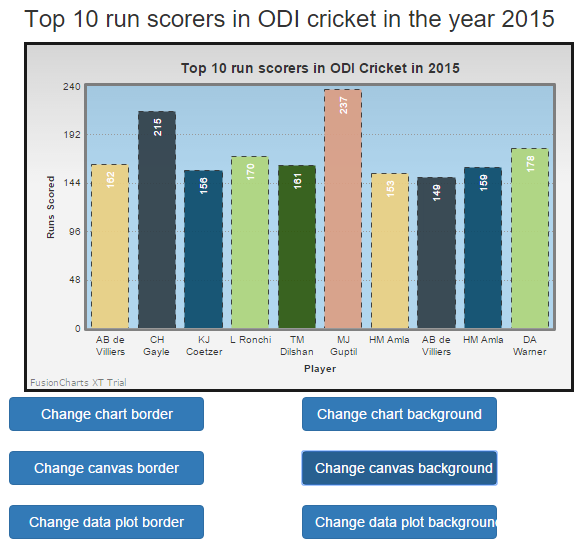
Changing the data plot background
The JSON object for data plot background properties is given below:
var dataPlotBackgroundProperties = {
  //list of colors to be applied to the columns in the data plot
  "paletteColors" : "#EED17F,#2d3c45,#074868,#B0D67A,#2C560A,#DD9D82",
  //setting the transperancy of the data plots
  "plotFillAlpha" : 90
};
One can even fill gradient inside the data plot, but to keep it simple and demonstrate the approach I am going to fill it with different colors. The implementation of the changeDataPlotBackground() method is shown below:
function changeDataPlotBackground(){
  var dataPlotBackgroundProperties = {
    //list of colors to be applied to the columns in the data plot
    "paletteColors" : "#EED17F,#2d3c45,#074868,#B0D67A,#2C560A,#DD9D82",
    //setting the transperancy of the data plots
    "plotFillAlpha" : 90
  };
  apiChart.setChartAttribute(dataPlotBackgroundProperties);
}
The chart with data plot background looks like below:
In the above examples, I have left a few properties so as to keep the article simple and still convey the approach to apply different properties. To view all the available properties:
 Node.js : Column Chart using FusionCharts with MongoDB