
DOJO is one of the greatest JavaScript framework for building the charting applications. But, it is not widely used in many applications due to the lack of popularity and lack of community awareness for the DOJO framework. However, the recent developments with this framework offers wide range of options for drawing the charting tools. I would write series of articles on DOJO framework and charting capabilities in detail. Subscribe to our blog here to get the latest updates from our website. This article explores the Pie Chart functionality in the DOJO charting API. It is only the very basic how to start creating the simple Pie Chart with the limited set of data. In my next articles, I would come up with few advanced charts with dynamic data. (Read: How to setup DOJO application?)

Pie Charts are most widely used for representing the data in the graphical way. WikiPedia defines pie chart as follows “A pie chart (or a circle graph) is a circular chart divided into sectors, illustrating numerical proportion“. In DOJO, charting can be done using the API dojox.charting.Chart. This is the common API which has set of attributes to define the different type of charts. I have used DOJO 1.9 for writing this example program. Look into the following sample code:
HTML Code:
<!--Green Pie Chart -->
<div id="pieChart1" style="width: 600px; height: 200px; "></div>
<!--Blue Pie Chart-->
<div id="pieChart2" style="width: 600px; height: 200px;"></div>
JavaScript Code (DOJO):
require(["dojox/charting/Chart",
"dojox/charting/axis2d/Default",
"dojox/charting/plot2d/Pie",
"dojox/charting/themes/PlotKit/green",
"dojox/charting/themes/PlotKit/blue",
"dojox/charting/action2d/MoveSlice",
"dojo/ready"],
function(Chart, Default, Pie,green,blue,MoveSlice, ready){
ready(function(){
var chart1 = new Chart("pieChart1");
chart1.addPlot("default", {type: Pie});
chart1.setTheme(green);
chart1.addAxis("x");
chart1.addAxis("y", {vertical: true});
chart1.addSeries("Series 1", [1, 2, 2, 3, 4, 5, 5, 7]);
var mag1 = new dojox.charting.action2d.MoveSlice(chart1,"default");
chart1.render();

var chart2 = new Chart("pieChart2");
chart2.addPlot("default", {type: Pie});
chart2.setTheme(blue);
chart2.addAxis("x");
chart2.addAxis("y", {vertical: true});
chart2.addSeries("Series 1", [1, 2, 2, 3, 4, 5, 5, 7]);
var mag2 = new dojox.charting.action2d.MoveSlice(chart2,"default");
chart2.render();

});
});
dojox.charting.Chart
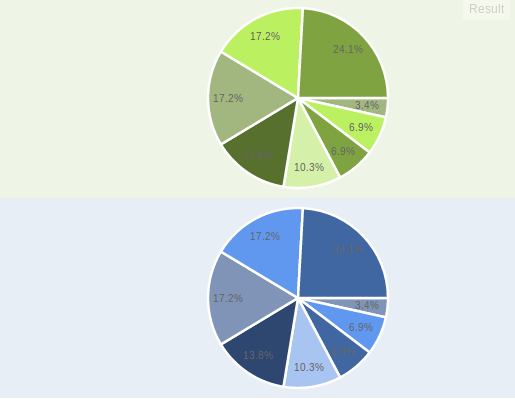
This is the JavaScript class used for creating the chart widget. This can be created any number of times depends on how many widgets required. In the above examples, I have created two pie chart widgets named as green and blue.
dojox.charting.themes.PlotKit.green
This is the theme for the background color and styles. DOJO has the predefined set of themes and its API reference which can be initiated and used for your charts. You can find the list of available themes here.
dojox.charting.action2d.MoveSlice
This is very nice effect while moving the mouse over to the pie chart. A slice will be moved out and indicate the selection area. This appearance gives very good feel for the widget.
You can view the live demo of DOJO Pie Chart.
Recommended Books:
 How to Create Tooltip in DOJO?