Introduction to Java Memory Management
In this article I am going to explain more about the JVM memory management inside Java Virtual Machine (JVM). If you are a Java developer, understanding the Java memory management inside JVM will be much helpful on investigating performance issues related to memory leak, garbage collection, etc. which are critical to production grade applications.
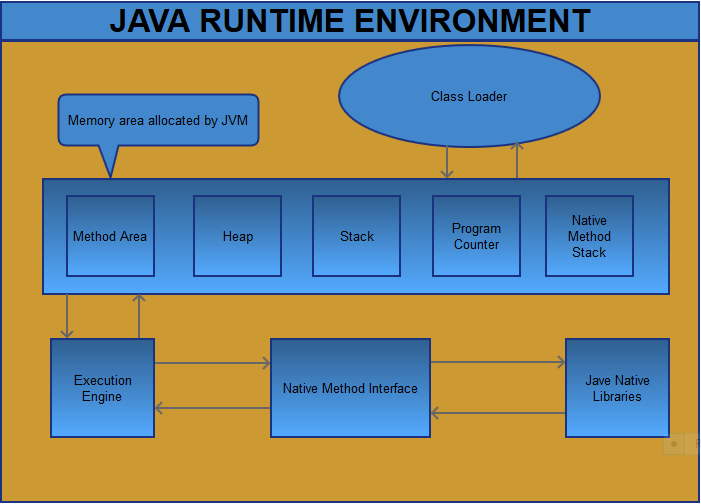
The following are the list of segments inside Java Virtual Machine (JVM) for storing the runtime data required for the application execution. At the end of this tutorial you will be able to understand how JVM allocates memory and what are the important commands for sending instructions to JVM for the memory allocation. If you have any questions related to JVM or you are facing issue like memory leak, please post it in the comments section.
The following are key memory segments inside a JVM:
- Program Counter (PC) Register
- Method Area
- Heap
- Java Stack
- Native Stack

Program Counter (PC)
One of the memory area allocated by JVM is program counter (PC). This segment stores the memory address of the Java Virtual Machine (JVM) instructions currently being executed. A program counter is created every time a new thread is created. Program counter keeps a pointer to the current statements that is being executed in the current thread. If the current executing method is a native method, the counter register will be undefined.
Method Area
Method area inside JVM used for storing the type / class information. When first time running a Java application, classloader will tries to load the classes by using the fully qualified name of each classes. Classloader will read the class file as stream of binary data and store the details inside method area. Method area is also responsible for allocating the memory to store the class / static variables. Method area is common for all the threads, so it must be designed to be thread safe.
The memory of the method area could be allocated on JVM’s own heap. It is up to the implementation decision and not mandated by the specification. The method area also can be garbage collected. If a class becomes unreferenced, a JVM can unload the class to keep the memory occupied by the method area at a minimum.
The following are the other list of details that are stored in method area:
Type Information
The following are the list of type information stored inside method area:
- The fully qualified name of the type
- The fully qualified name of the type’s direct superclass (unless the type is an interface or class java.lang.Object, neither of which have a superclass)
- Whether or not the type is a class or an interface
- The type’s modifiers
The Constant Pool
A method area has a constant pool where it stores the literals like String, number, etc. and symbolic references to types, fields and methods. All the data stored in the constant pool is referenced using an index similar to an array. This constant pool is acting as the central location for dynamic linking of Java programs.
Field Information
The following details about fields are stored in the method area. Apart from that it stores the order in which the fields are declared by the class or interface also recorded in memory.
- Field Name
- Field Type
- Field Modifiers
Method Information
The following details about methods are stored in the method area. Apart from that it stores the order in which the methods are declared by the class or interface also recorded in memory.
- Method Name
- Method return type or void
- The number of parameters
- The type of parameters in order
- The method’s modifiers
Java Stack
Java stack is the memory portion used by the JVM threads to store the thread specific data. Stack memory is not shared among all the threads and it is created for each thread separately. Any data related to a method like local variables, object references to heap are stored in the stack memory. When ever a thread enters a new method, a new block called as stack frame will be created inside stack memory for storing the method specific details. When the thread completes the execution of that method, corresponding stack frame will be pushed out of the stack memory. The total memory allocated for stack is very less compared to the heap memory.
If the current stack memory is not enough for holding the method data (this happens if the method have recursive operation), JVM will throw java.lang.StackOverflowError error. If you are getting this error, you have to increase the stack memory or analyse the program whether it uses any recursive calls by mistake. Deep recursions also can cause StackOverflow errors.
How to increase stack memory?
Developer can change the stack memory size by using the -Xss command. This size is the individual thread’s stack size. That means each thread will have the same amount of memory allocated for their operations.Many Java Virtual Machine publishers set the default size of a thread’s call stack to 256KB.
Java Heap
If your application creating new objects or using arrays, then all the instances are stored in the heap memory of the Java Virtual Machine (JVM). Heap is the primary storage inside JVM for storing the runtime data that are accessed by the multiple threads. Heap memory is the common for all the threads, the data stored in the heap is accessible to all the threads running on JVM.
If the maximum size of the heap is utilized by the JVM, then garbage collector will be triggered for claiming the memory from the unused objects inside heap. Note that, application developer has not control on garbage collector.
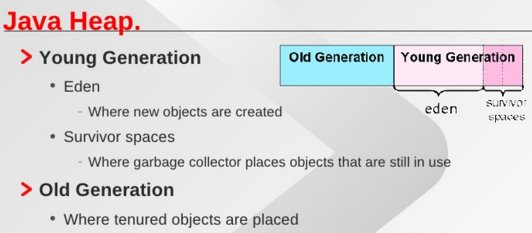
Heap memory has the two logical portion based on the lifetime of every objects. First one is Young Generation and second one is Old Generation.
Young Generation:
Heap memory creates new objects in the portion called as young generation. This portion is dedicated for storing the young objects which are very newly created by the Java applications.
Old Generation:
This is another logical portion inside heap memory for storing the older objects. When new objects are created, that are reside inside young generation portion for certain period of time, after that those objects will be pushed to the old generation portion. Objects which are survived from garbage collector for few times will be promoted to the old generation.
If the total allocated memory is not sufficient for storing the new objects, then JVM will throw a java.lang.OutOfMemoryError. Application developers can customize the memory allocation for heap inside JVM by passing the following parameters:
JVM Heap Settings:
- -Xmx<size> : Maximum heap size allocated
- -Xms<size> : Initial heap size allocated
- -Xmn<size> : Size of the young generation objects storage inside heap. This parameter is not used most of the times.
Native Method Stack
Similar to the Java stack, there is a Native Method Stack for storing the thread data for native method calls. This native method stack is available only if the JVM supports the native method calls. Otherwise there is no need for having the native method stack. Memory size is managed similar to general JVM stacks like fixed or dynamic. This is created for per thread basis and can not be shared among all the threads. If the native method stack is full and don’t have the enough memory to store the new data, then JVM will throw StackOverflowError or OutOfMemoryError accordingly.
I hope this tutorial provide good amount of information about the JVM memory allocation. If you have any questions, please write it in the comments section.

 Default Keyword in Java