
Consider a scenario where you can’t run the application in your development environment, e.g. say your application can run only on a server machine (because it is dependent on some third party interface that are not accessible in your development machine) and you have to resolve a problem (bug). What you can do?
Java Remote Debug
The solution is Java Remote debugging. Remote debugging is debugging an application by connecting the remotely running application with your development environment ( i.e. you can say to connect with code in your IDE).
also read:
- Java Tutorials
- Java EE Tutorials
- Design Patterns Tutorials
- Java File IO Tutorials
How remote debugging works?
Remote debugging feature is provided by Java specification itself. Java provides this feature using listener binding mechanism. Basic concept is pretty simple and straightforward:
- Application to be debugged would attach a socket to itself and then would listen debug instructions on that socket.
- Debugger would bind itself to that socket and then send instructions on that socket.
Running an java application in debug mode
As I said earlier, for remote debugging, you need to run that application in debug mode. To run an application in debug mode requires to provide specific jvm arguments to “java” command.
JVM arguments for DEBUGGING
For JVMs prior to 1.5
One need to supply two arguments, -Xdebug and -Xrunjdwp. -Xdebug tells JVM to run the application in debug mode, while -Xrunjdwp is used to supply debug parameters (It can also be used in JVM 1.5 or 1.6 as well)
e.g. -Xdebug -Xrunjdwp:transport=dt_socket,address=8000,server=y,suspend=n
For JVMs 1.5 and 1.6
Debug library is passed as -agentlib argument, along with debug paramters. Native library name for debugging is jdwp, so one need to supply -agentlib:jdwp along with debug paramters.
e.g. -agenlib:jdwp=transport=dt_socket,address=8000,server=y,suspend=n
Detail of debug parameters
- Name: help
Is Optional : Yes
Default Value: N/A. This parameter doesn’t have any value at all.
Description: It prints all the available options on the console and exits the JVM.
Example: java -agentlib:jdwp=help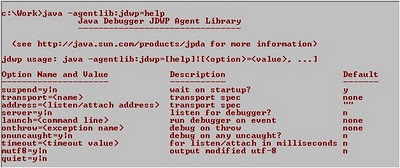
- Name: transport
Is Optional: No (It is a required field)
Default Value: No default value specified in specifications. Totally depends upon native lib provided by JVM implementation.
Description: Transport protocol implementation used for communication between debugger and application. Sun JVM ships two implementations, Socket Transport and Shared Memory Transport. Value for Socket Transport is “dt_socket”, while that of Shared Memory Transport is “dt_shmem”.
Shared Memory is available only on Microsoft Windows. - Name: serverIs Optional: Yes
Default Value: n
Description: Tells whether JVM will be used as Server or as client in reference to JVM-Debugger communication. If JVM will act as server, then debugger will attach itself to this JVM, otherwise if JVM will act as a client, then it will attach itself to debugger. - Name: addressIs Optional: Optional when JVM acts as server and Required when JVM acts as client.
Description: Specifies the socket address.
If JVM is server (i.e. server argument is set to ‘y’): Then JVM listens the debugger at this socket. If address is not specified, then JVM picks any of available socket, starts listening on this socket and prints its address on console.
If JVM is client (i.e. server argument is set to ‘n’): JVM attaches itself to this address to connect itself to debugger. - Name: timeoutIs Optional: Yes
Description: As its name signifies, it is the wait time for JVM. If JVM is server, then JVM will wait for “timeout” amount of time for debugger to attach to its socket and if JVM is client, then it will exit if fail to attach to debugger in timeout time. - Name: suspendIs Optional: yes
Default Value: y
Description: Tells JVM to suspend the invocation of application(s) until the debugger and JVM are attached together.
Apart these there are launch, onthrow, onuncaught options as well, details of which can be find at JPDA. But these options are seldom used.
Now, lets take simple example to debug a program using eclipse.
Steps
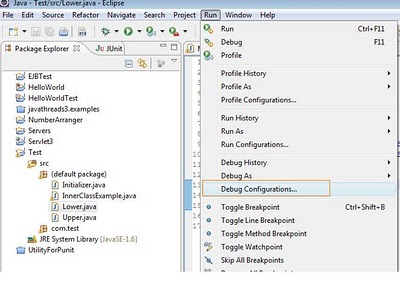
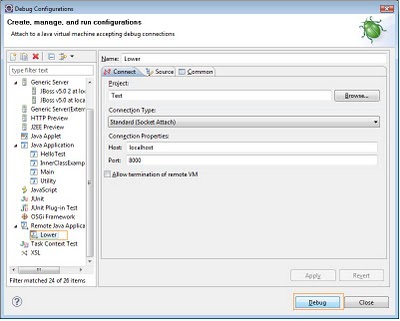
- Select from eclipse menu, Run->Debug Configuration, It will open Debug Configuration setup.
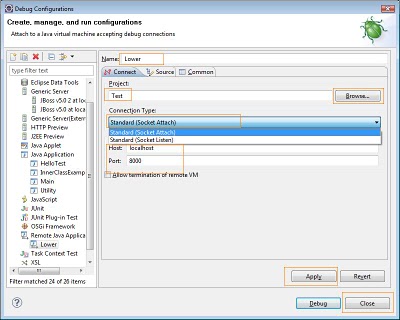
- On Debug configuration window, create a new “Remote Java Application” configuration.
- Select the project to be debugged and provide a Name.
- Select connection type, Socket Attach or Socket Listen. Select Socket Attach, if you want to attach the debugger to application, i.e. application is running in Server mode. On the other hand, select Socket Listen, in case you want debugger to listen for JVM to connect, i.e. JVM is running in client mode and debugger is running as server.
- If JVM to be run in Server mode, then first start JVM in debug mode and then start the newly created debugger,
- And if Debugger to be run in Server mode, then first start the debugger and then start JVM.
Debugging in Action
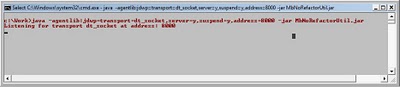
In this way one can debug any java application using any standard java debugger.
Later in some post I will try to cover “How to debug” for different kind of java application, e.g. debugging application running in Tomcat or Jboss, debugging a JWS and like that.
 Spring BIND and NESTEDPATH Tags (<spring:bind> and <spring:nestedPath>)