
JMeter is a software that is very useful for load test, performance test and various other testing requirements of your application. This tool is developed and maintained by Apache Software Foundation as open source project. In most of the projects, JMeter tool is primarily used for load test the web applications. It is a simple Java desktop tool that can run on any environment where JVM is installed. In this JMeter tutorial, I am going to explain the following topics.
![]()
The list topics covered in the tutorial is:
- Protocols support
- How to install and run JMeter?
- Creating a test plan?
- Add a thread group
- Add a HTTP request defaults
- Add a HTTP request sampler
- Add a view results in table listener
- Run JMeter in command line
- Best Practices for JMeter
- Summary
- JMeter References and Books
Protocols Support
The following protocols are supported by JMeter:
- Web – HTTP, HTTPS
- Web Services – SOAP / XML-RPC
- Database via JDBC drivers
- Directory – LDAP
- Messaging Oriented service via JMS
- Service – POP3, IMAP, SMTP
- FTP Service
How to Install and Run JMeter?
JMeter is a stand-alone desktop application built on Java Swing APIs. It is very simple to install and run the JMeter tests without any programming knowledge. Follow the steps to download and install in your system.
- Download the JMeter software from download. The latest version of JMeter is 2.13, the minimum version of Java 6 is required to run.
- Once downloaded, just extract the zip file into your system. There is no further configurations required to run the JMeter tool.
- In Windows OS, just invoke the
jmeter.batunder directoryapache-jmeter-2.13\bin. This will open a JMeter GUI. - That’s it, you have installed JMeter in your system. The next step would be to configure the test plan and execute the tests.
Creating a Test Plan
In this section, I am going to explain about how to create a basic test plan for measuring the response time a web page using JMeter GUI screens. A test plan is the root element in the left side menus. A test plan is created using the various components and configured to simulate particular scenario.
If you want to run any tests, first thing you have to configure the test plans by adding various components in the JMeter. The following are the some of the components that are used for simulating a test scenario.
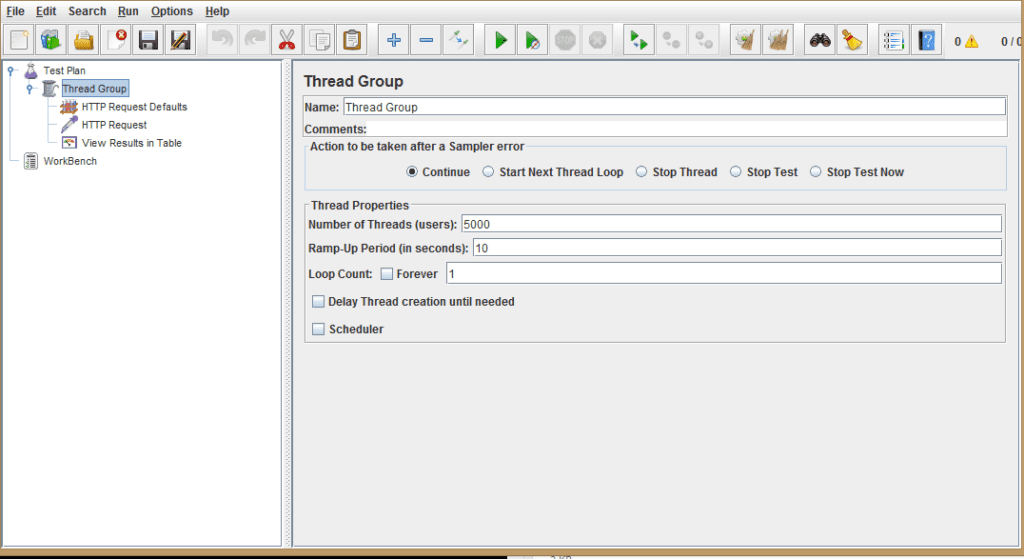
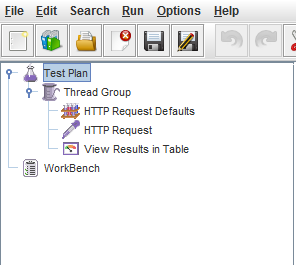
Here is the basic structure of a test plan in the GUI mode:
Add a thread group
As a first step, please add a thread group to your test plan. This must be the first step for creating the test plans. A thread group is a set of threads executing the same scenario. Test users are simulated using threads. Threads are created as part of the thread group.
Steps to add thread group:
- Right-click on Test Plan
- Mouse over Add >
- Mouse over Threads (Users) >
- Click on Thread Group
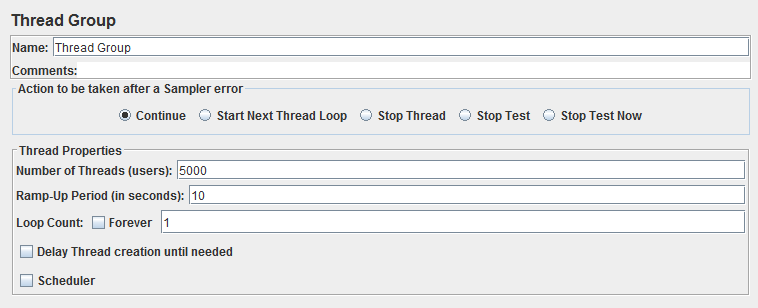
Here is the basic elements in the thread group:
Add an HTTP Request Defaults
HTTP Request Defaults is one of the configuration node in the JMeter components. These configuration nodes are used for defining the common variables for the samplers. In our example, we are defining http request defaults for the http request sampler. These configuration nodes are executed before the samplers, so any fields configured in this defaults and not configured in the sampler will be taken as the default value.
Each sample have it’s own default configuration nodes. Some of them are listed here:
- FTP Request Defaults
- HTTP Cache Manager
- HTTP Cookie Manager
- Java Request Defaults
- LDAP Request Defaults
Steps to add HTTP request defaults:
- Select Thread Group, then Right-click it
- Mouse over Add >
- Mouse over Config Element >
- Click on HTTP Request Defaults
Here is the basic elements in the HTTP request defaults:
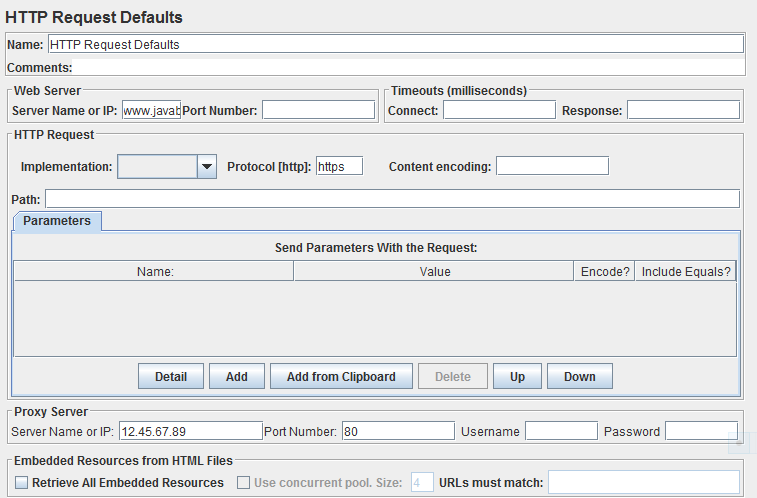
Web Server Details
This section helps you to configure the default server details for all the HTTP request samplers. You can fill only the necessary fields and leave all other fields as blank. For example, Server Name and Port Number fields are common for all the request, so you can fill in the details here and leave it as blank in the individual request sampler form.
HTTP Request Details
Update your request details like Path, Protocol, etc. which are common for all the requests here.
Proxy Server Details
Proxy server tab in the HTTP request defaults helps you to configure the proxy servers, if you are running the tests behind a proxy server and trying to access the web application that is outside your network. This situation arises when you are working inside a company and trying to execute tests using the live website URLs. If your company is using the .PAC file for routing the proxy server, you could open the .PAC file and note down the IP address of the proxy server and port address. There are four fields to e filled depends on the environment.

- Server Name or IP
- Port Number
- Username
- Password
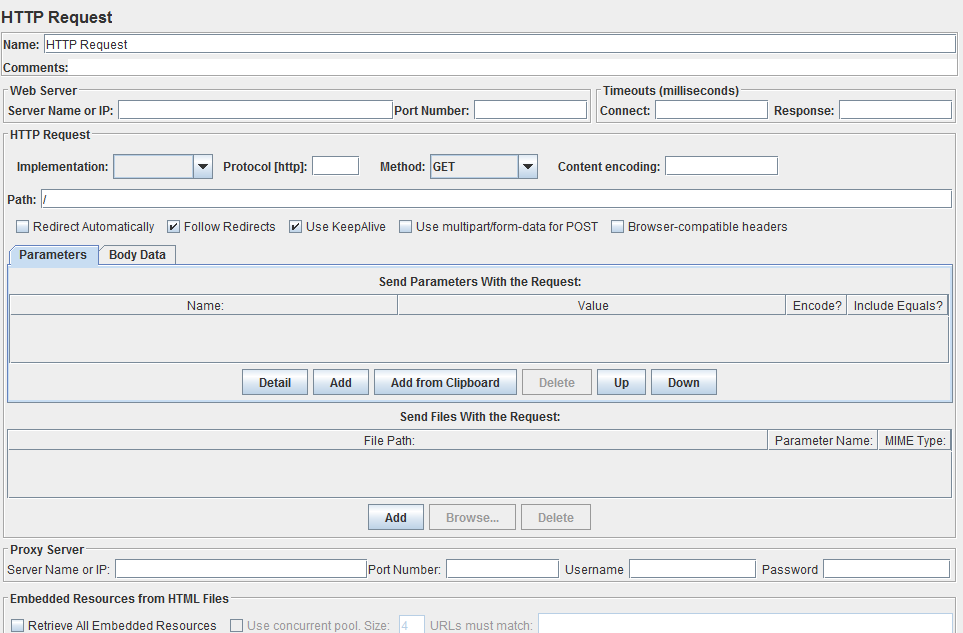
Add an HTTP Request Sampler
A sampler is a component that is used for sending the request to different kind of servers. For example, if your test has to perform the HTTP request, then you have to add the HTTP Request Sampler to your test plan. Like that we have various samplers built-in with JMeter.
The above mentioned are only few samplers. There is a huge list of samplers available for the configuration. In this tutorial, we are using the http request sampler.
Steps to add HTTP request sampler:
- Select Thread Group, then Right-click it
- Mouse over Add >
- Mouse over Sampler >
- Click on HTTP Request
Here is the basic elements in HTTP request sampler:
Add a View Results in Table Listener
JMeter has a concept called listeners that are used for displaying the results in different view like table, tree, graphs, etc. to the attache UI screens. To view the response content from a sampler, you have to add the any one of the listener to the test plan for viewing the data.
Here we are using the View Results in Table for viewing the response data in the tabular data. Below is the steps to add the table listener and sample screenshot of displaying the data in a tabular format.
Steps to add view results in table listener:
- Select Thread Group, then Right-click it
- Mouse over Add >
- Mouse over Listener >
- Click on View Results in Table
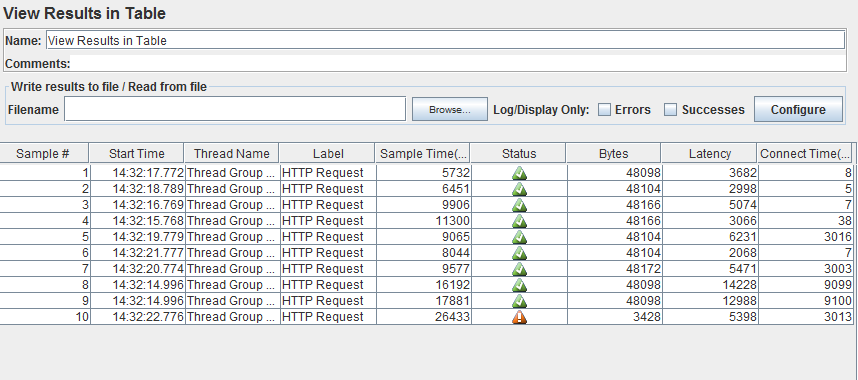
Sample Time:
Sample Time or Response Time is the difference between the time when request sent and time when response has been fully received. Response time will be always greater than latency time.
Latency:
Latency is a difference between time when request was sent and time when response has started to be received.
Run JMeter in Command Line
It is not advisable to use JMeter in GUI for actual load test. The reason is that GUI mode consumes lot of memory for processing the data and display to the user. If you performing any serious real time test, it is highly recommended to test it in the command line. In this section I would explain how to run JMeter test in the command line.
jmeter -n -t D:/results.jmx -l D:/report.jtl
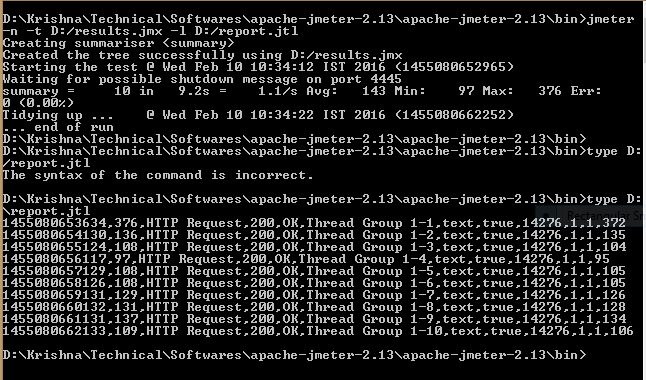
In the above command line options,
- -n tells that you are running the test in non-GUI mode
- -t tells the complete path of the JMX file (it is the format of the test plan used for JMeter tests)
- -l tells the complete path of the results where it is stored.The results have the JTL as the file extension. These results can be stored as either XML or CSV format.
Connect time is the time taken to establish the connection between server including SSL handshake.
Best Practices for JMeter
There are many recommended best practices in JMeter for the better performance. Here I am listing down few of the important tips that is wirth remembering while you are executing the test plans.
- Use non-GUI mode while executing the real time test plans
- Use only few listeners. The listeners parses the results in easily readable manner, but it consumes lot of memory.
- View Result Tree listeners consume lot of memory and JMeter may run out of memory. It is recommended to disable or run only enabling “Errors” checked. It is same for all other graphical display inside JMeter.
- Clean the tab before every test run
- Monitor the logs
- Make sure that the JTL file is saved in XML format and not CSV.
- Assign a meaningful JTL file name
Summary
I hope this tutorial helped you to understand the basic idea on how to use JMeter on GUI and command line mode. We have explored how to create a basic test plan for evaluating the response time for HTTP request. As part of the test plan, we have added HTTP Request Defaults, HTTP Request Sampler and View Results in Table. As you are aware, JMeter is most powerful and popular testing tool for performing load test and stress test for your applications.
After reading this tutorial, let’s try yourself creating a test plan and explore the different configuration elements present in the tool.
Happy Reading!!!
 EOFException Example in Java