
This example illustrates how to view the current status of heap in the JVM where eclipse application is running. Eclipse allocates the pre-defined heap memory for its own use. If the usage reaches the maximum level, the performance of your eclipse would be very slow. Whenever it reaches the maximum level, eclipse triggers the Garbage Collection to free the memory. This would internally slow down the process to run the Garbage Collection threads. In Eclipse, you can change the settings to view the current memory usage in heap and fore the Garbage Collection to run.
Navigate to the following path to enable this feature:
Heap Status Settings in Eclipse
Windows -> Preferences -> General -> Show heap status (check box)
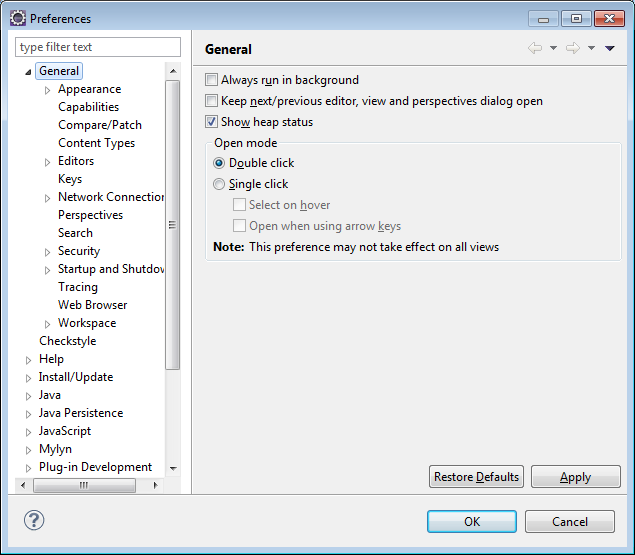
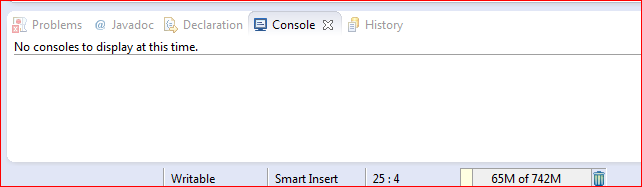
It will look like as in the below screenshot. If you look at the below picture, the heap details are shown in the status bar of the Eclipse application. The small icon display on right side will enforce the garbage collection.
 How Much Faster Is Java 8?